Scores
One clear score for every UK area.
Turn everything we know about a neighbourhood into a single number from 0 to 100. Pick one of four ready-made setups, or weight it your own way, and get the same trustworthy answer every time.
A score you can stand behind.
No black box. Every number shows what it is built from, how sure we are, and gives you the same answer every single time.
One number, and the reasons behind it
Every score opens up into the handful of things it is built from, so you always see why an area landed where it did.
You know how sure we are
Every part of the score comes with a confidence level, so thin data never hides behind a confident-looking number.
The same answer, every time
Ask for the same area twice and you get the same score. Nothing drifts, so you can rely on it in front of a customer.
Tied to a version you can cite
Every score carries the methodology version that produced it, so a decision can be defended months later.
0 to 100 · four setups · your own recipes
Tuned to the way you actually work.
Pick the setup that fits the job
Moving home, choosing a business location, weighing up an investment or a general read. Each setup already weighs up the categories that matter most for that decision.
Or weight it your own way
Care more about safety than schools? Turn the dials. Save your mix once and your whole team scores every area the same way from then on.
One score, built from real public data, weighted the way you choose and the same every time. Everything you need to rank areas with confidence.
Try in the playground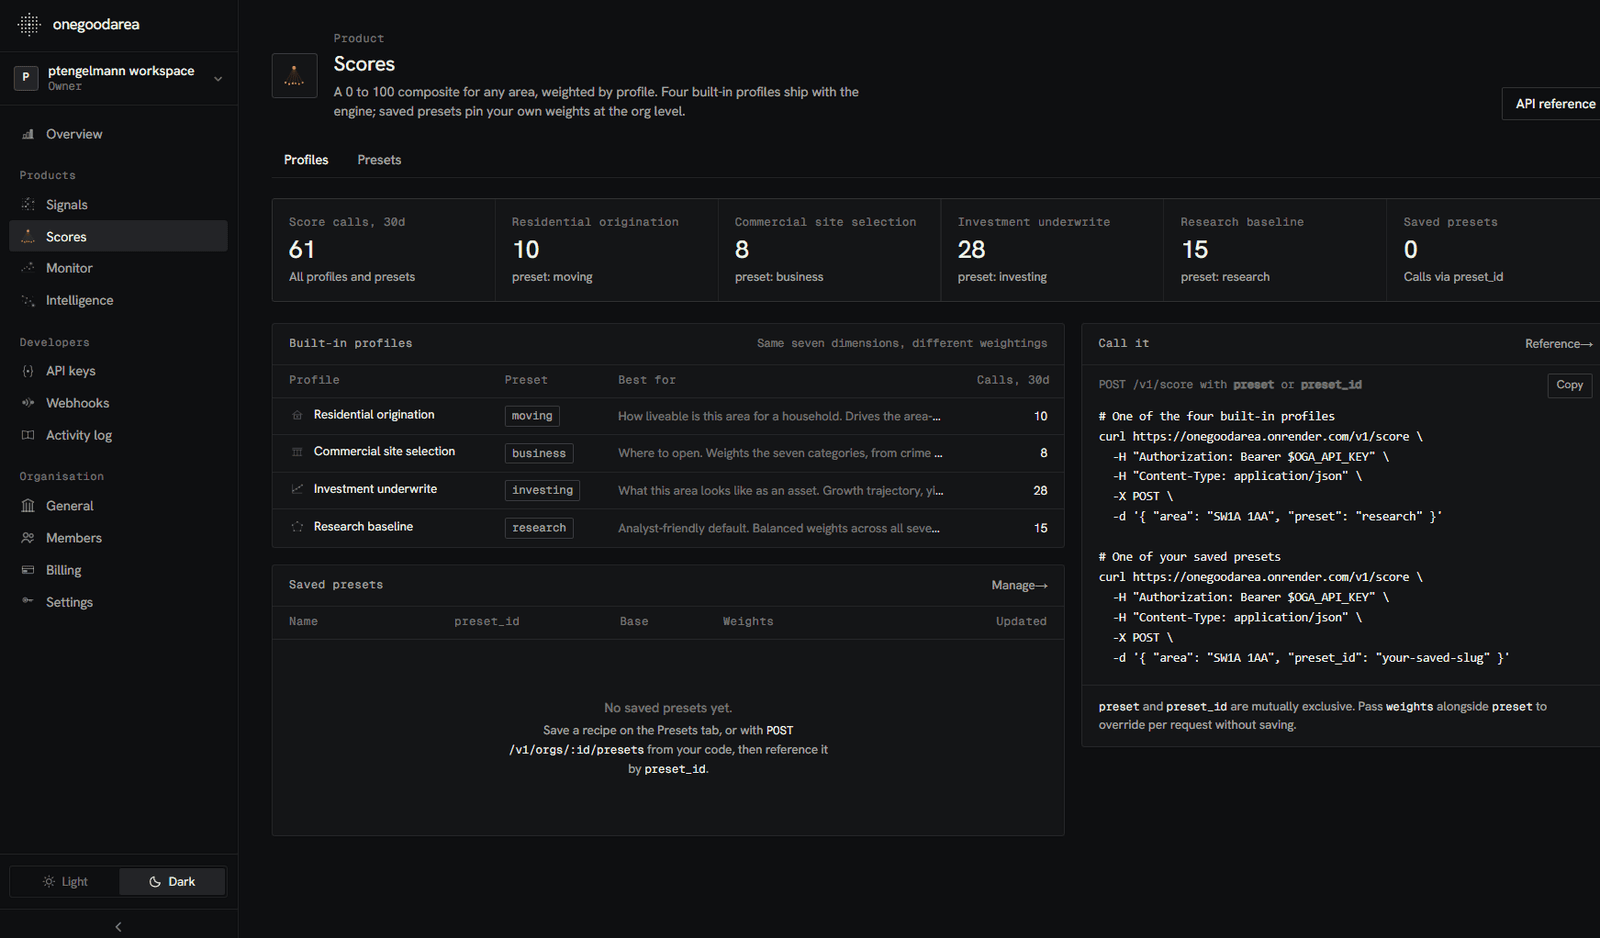
The Scores workspace
Put the score to work.
Show it, rank on it, decide with it or match it to your own risk. One number that drops straight into the way you already work.
One number your whole team can agree on, defend to a regulator and drop straight into the product.
Show it
Show a clear area score on any listing, application or dashboard.
Rank on it
Rank and shortlist a whole list of areas in one go.
Set a pass mark
Set a pass mark and let the score flag what needs a closer look.
Agree one recipe
Agree one way of scoring and everyone on the team uses it, automatically.
Frequently asked
Scores, answered.
How is the score worked out?
We take the public data about an area, look at the handful of things that matter for what you are deciding, weigh them up and turn it into one number from 0 to 100.
What are the four setups?
Moving home, choosing a business location, weighing up an investment, and a general research read. Each one focuses on the categories that matter most for that job.
Can I change what the score cares about?
Yes. Turn the dials to weight things your own way for a single request, or save your mix as a recipe so your whole team scores every area the same way.
Does an AI decide the score?
No. It is worked out the same way every time from the data underneath, so there is no black box and nothing quietly changes on you.
Will the same area always get the same score?
Yes, as long as the setup is the same. Every score is tied to a published version you can point back to, which matters when you have to defend a decision.
Do I get to see why an area scored the way it did?
Always. Every score opens up into its parts, how much each one counted, and how confident we are in each.
How do I use it?
One API call gives you the score and its breakdown. Or book a call and we will run it on your own areas.
One score your whole team can stand behind.
Rank any UK area 0 to 100, weighted the way you work and the same every time. Ready to show a customer or defend to a regulator.